




























Ethereum (ETH) is showing strong technical signs of a short-term bottom reversal, with a projected surge to $2,163.
Table Of Content
Ethereum targets $2,163 following double bottom completion
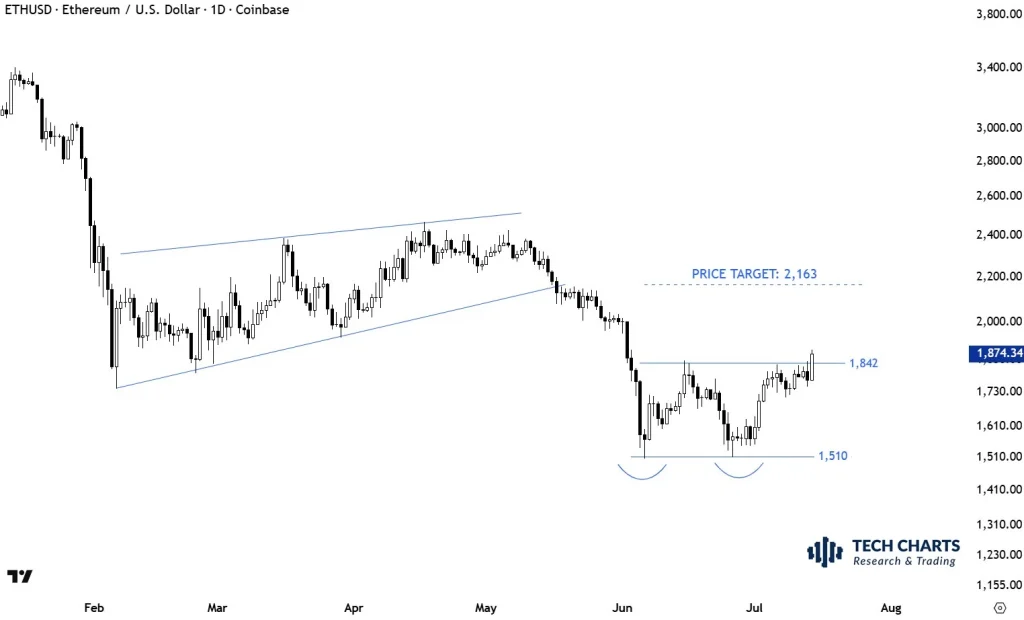
As shown in the chart below, ETH has clearly formed a classic double-bottom reversal pattern near the $1,510 support. Even more, just two days ago, the coin broke above the $1,842 neckline resistance after a period of consolidation. At press time, ETH was still sustaining this bullish momentum, trading at about $1,883 (+6.88% in the last 24 hours).
Source: Tech Charts
According to veteran chartist Aksel Kibar, this setup projects an upside target of $2,163 – calculated from the pattern’s move from the double bottom to the neckline. It also follows a similar short-term bullish prediction made by the analyst just three days ago, indicating continued bullish momentum in the reversal.

Further supporting this thesis is the rising multi-month trendline, which shows higher lows between February and May. This trajectory means buyers are consistently accumulating even as prices rise, further reinforcing the previously mentioned bullish thrust.
Recent developments fueling upside bias
In addition to the above technical analysis, EthSystems, a spin-off from the Ethereum Foundation, recently launched as an independent for-profit research and engineering company. The Ethereum community expressed optimism for the event, as it signaled Ethereum’s commitment to providing blockchain privacy to heavily regulated institutions.
Furthermore, today’s cooler-than-expected inflationary data encouraged investors to flow into crypto assets. Other than retail investors, institutions continue to accumulate the coin, with Bitmine Immersion Technologies now holding 5.77 million ETH tokens (about 4.8% of the circulating supply).
Key levels to watch for
Important levels to watch out for now include the $1,842-$1,850 double-bottom neckline resistance. A downside penetration below this threshold could invalidate the bullish setup.
Additional resistance lies between $1,900 and $2,000, which marks the highs hit between May and June just before the sharp decline.
Breaking above these two zones, coupled with rising trade volumes, would pave the way for the $2,163 target.
Was this writing helpful?
Story Ends Here
Trust with CoinPedia:
CoinPedia has been delivering accurate and timely cryptocurrency and blockchain updates since 2017. All content is created by our expert panel of analysts and journalists, following strict Editorial Guidelines based on E-E-A-T (Experience, Expertise, Authoritativeness, Trustworthiness). Every article is fact-checked against reputable sources to ensure accuracy, transparency, and reliability. Our review policy guarantees unbiased evaluations when recommending exchanges, platforms, or tools. We strive to provide timely updates about everything crypto & blockchain, right from startups to industry majors.
Investment Disclaimer:
All opinions and insights shared represent the author’s own views on current market conditions. Please do your own research before making investment decisions. Neither the writer nor the publication assumes responsibility for your financial choices.
Sponsored and Advertisements:
Sponsored content and affiliate links may appear on our site. Advertisements are marked clearly, and our editorial content remains entirely independent from our ad partners.
Read the Next News